Sweetened beverages contain added sugars that enhance flavor but contribute to higher calorie intake and increased risk of health issues like obesity and diabetes. Unsweetened beverages offer a healthier alternative by providing hydration without extra calories or sugar-induced spikes in blood glucose. Choosing unsweetened options supports better metabolic health and reduces the likelihood of developing chronic conditions related to excessive sugar consumption.
Table of Comparison
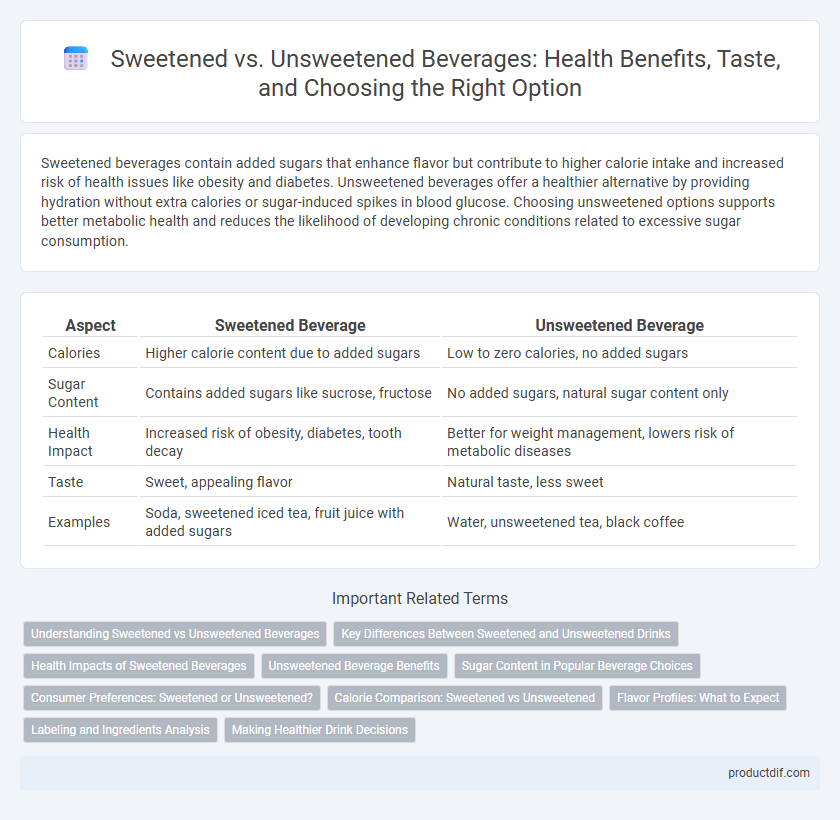
| Aspect | Sweetened Beverage | Unsweetened Beverage |
|---|---|---|
| Calories | Higher calorie content due to added sugars | Low to zero calories, no added sugars |
| Sugar Content | Contains added sugars like sucrose, fructose | No added sugars, natural sugar content only |
| Health Impact | Increased risk of obesity, diabetes, tooth decay | Better for weight management, lowers risk of metabolic diseases |
| Taste | Sweet, appealing flavor | Natural taste, less sweet |
| Examples | Soda, sweetened iced tea, fruit juice with added sugars | Water, unsweetened tea, black coffee |
Understanding Sweetened vs Unsweetened Beverages
Sweetened beverages contain added sugars such as high-fructose corn syrup or cane sugar, contributing to higher calorie content and increased risk of obesity, diabetes, and heart disease. Unsweetened beverages, like plain water, unsweetened teas, and black coffee, offer hydration without added calories or sugar-related health risks. Choosing unsweetened options supports better blood sugar control and overall metabolic health.
Key Differences Between Sweetened and Unsweetened Drinks
Sweetened drinks contain added sugars or artificial sweeteners that increase calorie content and enhance flavor, often leading to higher risks of obesity and diabetes. Unsweetened drinks, such as water, unsweetened tea, or black coffee, have zero or minimal calories and no added sugars, promoting better hydration and reduced risk of metabolic diseases. Choosing unsweetened beverages supports weight management and reduces daily sugar intake, critical factors in maintaining overall health.
Health Impacts of Sweetened Beverages
Sweetened beverages contribute significantly to the global rise in obesity, type 2 diabetes, and cardiovascular diseases due to their high sugar content and empty calories. Consuming sugary drinks increases insulin resistance and promotes fat accumulation, leading to metabolic syndrome and other chronic health conditions. Unsweetened beverages, by contrast, provide hydration without added sugars, supporting better weight management and reducing the risk of health complications.
Unsweetened Beverage Benefits
Unsweetened beverages provide hydration without added sugars, reducing calorie intake and lowering the risk of obesity and type 2 diabetes. They support metabolic health by avoiding blood sugar spikes and promoting stable energy levels. Consuming unsweetened drinks like water, unsweetened tea, or black coffee also minimizes exposure to artificial sweeteners and additives linked to adverse health effects.
Sugar Content in Popular Beverage Choices
Sweetened beverages like sodas and flavored coffees often contain high sugar levels, ranging from 20 to 40 grams per serving, significantly exceeding daily recommended limits. Unsweetened options, such as black coffee, unsweetened tea, or sparkling water, contain minimal to zero sugar, making them healthier choices for reducing calorie intake and preventing blood sugar spikes. Monitoring sugar content in popular drinks is crucial for managing obesity, diabetes, and overall metabolic health.
Consumer Preferences: Sweetened or Unsweetened?
Consumer preferences in beverages reveal a growing demand for unsweetened options due to increasing health consciousness and reduced sugar intake recommendations by organizations like the WHO. Market data shows a surge in unsweetened tea and coffee sales, reflecting a shift towards natural flavors and fewer calories. However, sweetened beverages remain popular among younger demographics seeking taste enhancement and energy boosts, highlighting a diverse consumer landscape.
Calorie Comparison: Sweetened vs Unsweetened
Sweetened beverages typically contain 90 to 150 calories per 12-ounce serving due to added sugars, while unsweetened options often have zero or negligible calories. Consuming sweetened drinks regularly can contribute to increased daily caloric intake and potential weight gain. Choosing unsweetened beverages supports calorie control and reduces the risk of metabolic conditions linked to excessive sugar consumption.
Flavor Profiles: What to Expect
Sweetened beverages deliver a pronounced sweetness that enhances flavors and masks bitterness, often resulting in a richer and more indulgent taste experience. Unsweetened drinks emphasize natural ingredient notes, showcasing subtle bitterness, acidity, and earthiness without added sugars. Flavor profiles in unsweetened beverages tend to be more complex and nuanced, appealing to those seeking authentic and less processed tastes.
Labeling and Ingredients Analysis
Sweetened beverages often feature high-fructose corn syrup, cane sugar, or artificial sweeteners prominently on labels, indicating added sugars that contribute to increased calorie intake and potential health risks like obesity and diabetes. Unsweetened beverages list minimal ingredients, typically water, natural flavors, or extracts, providing a clearer indication of a product free from added sugars, appealing to health-conscious consumers. Careful analysis of ingredient labels is essential for distinguishing between naturally occurring sugars and added sweeteners, enabling informed choices aligned with dietary goals.
Making Healthier Drink Decisions
Choosing unsweetened beverages significantly reduces added sugar intake, lowering the risk of obesity, diabetes, and heart disease. Sweetened drinks often contain high levels of fructose and artificial sweeteners that can disrupt metabolism and increase cravings. Prioritizing water, unsweetened tea, or natural fruit-infused drinks supports better hydration and overall health outcomes.
Sweetened vs Unsweetened Infographic